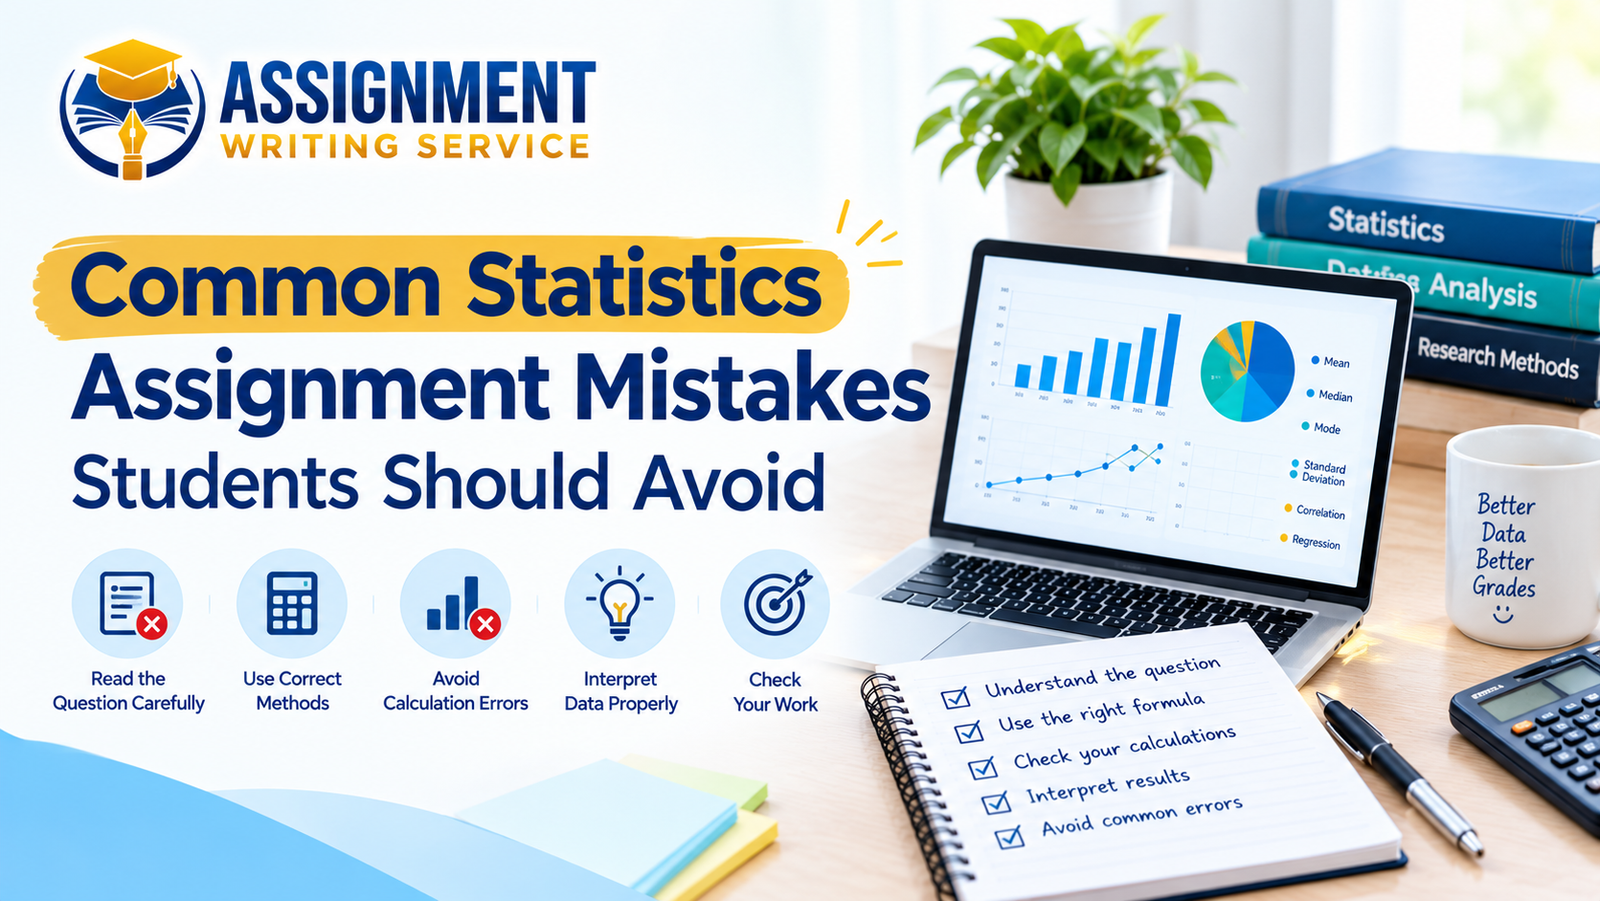
Statistics assignments help university students understand data, compare results, and explain important research findings. These assignments often require calculations, graphs, tables, and clear explanations of statistical results. However, many students make simple mistakes that can affect their final assignment quality. Understanding these common errors can help students prepare more accurate and organized academic work.
Statistics can feel difficult when students do not understand formulas or data analysis methods. Some students rush through calculations, while others struggle to explain their results clearly. Poor referencing and confusing charts can also make an assignment less effective. Students looking for academic guidance can explore Assignment Writing Services UK to learn about available assignment support.
Misunderstanding Assignment Instructions
One common mistake is starting a statistics assignment without reading the instructions carefully. Students may misunderstand the research question or overlook important requirements from their university. This can lead to irrelevant calculations, incomplete answers, and unnecessary information within the assignment. Before beginning, students should identify the main objectives and understand what each question requires.
They should also check the marking criteria to understand how their work will be assessed. Some assignments focus on calculations, while others require detailed explanations of statistical findings. Students must follow the requested format, word count, and submission instructions carefully. Understanding these requirements from the beginning can save time and prevent avoidable mistakes.
Using Incorrect Data
Accurate data is essential for producing reliable results in every statistics assignment. Students sometimes enter incorrect values or accidentally remove important information from datasets. Even a small data entry mistake can change calculations and affect the final findings. Therefore, students should check their original data before starting any statistical analysis.
They should also confirm that the dataset matches the research question and assignment requirements. Missing values, duplicate entries, and inconsistent formats can create problems during analysis. Spreadsheet tools can help students organize information and identify possible errors more quickly. However, students should always review their data rather than trusting software without checking.
Choosing the Wrong Statistical Method
Students need to select statistical methods that match their research questions and available data. Using an unsuitable method can produce results that do not answer the assignment question. For example, comparing two groups may require a different approach from studying relationships. Students should understand the purpose of each method before applying it.

-
Understand the Research Question
Students should identify exactly what they need to measure, compare, or explain. A clear research question makes choosing the correct statistical method much easier. They should also check whether their data contains categories, measurements, or repeated observations.
-
Learn the Main Statistical Methods
Mean, median, and mode describe different aspects of a dataset. Standard deviation explains how widely values vary around the average. Correlation measures the strength and direction of a relationship between variables. Students should learn when each method is suitable before using it.
- Check the Data Requirements
Different statistical tests require different types of data and assumptions. Students should check whether their information meets the relevant requirements before analyzing results. When necessary, they should consult lecture notes or ask their tutor for guidance.
- Explain the Method Clearly
Students should explain why they selected a particular statistical method for their analysis. A short explanation helps readers understand how the research question was addressed. They should also mention important assumptions or limitations when these affect interpretation.
Making Calculation Errors
Calculation errors are among the most common problems in statistics assignments. Students may enter incorrect values, use the wrong formula, or round numbers too early. These mistakes can affect averages, percentages, standard deviations, and other statistical results. Checking each calculation carefully can help students improve accuracy and avoid unnecessary confusion.
Students should write down their formulas before substituting values into calculations. They should also check whether they have used the correct units and decimal places. Spreadsheet software can make calculations easier, but formulas still need careful checking. Comparing selected results with manual calculations can help identify mistakes.
Students should avoid copying answers without understanding how those results were produced. Understanding each calculation makes it easier to explain the findings in academic writing. Students who need further guidance can explore statistics assignment support for information about available academic services. Regular practice can also improve confidence when working with statistical formulas.
Misinterpreting Statistical Results
Correct calculations do not automatically mean that students understand their statistical results. Students must explain what the findings mean in relation to their research questions. Some students make claims that their data cannot properly support. Others repeat numbers without explaining why those numbers matter.
For example, a positive correlation indicates that two variables tend to increase together. However, this relationship alone does not prove that one variable causes another. Students should understand this difference before discussing relationships between variables. Accurate interpretation makes statistical assignments more reliable and academically meaningful.
Students should also avoid making conclusions based on very limited information. They need to consider sample size, data quality, and possible limitations. If results are unexpected, they should discuss possible explanations without inventing unsupported reasons. Clear and balanced interpretation demonstrates a stronger understanding of statistics.
Creating Confusing Charts and Tables
Charts and tables help students present statistical information in a clear and organized way. However, poorly designed visuals can make accurate findings difficult to understand. Missing labels, unclear titles, and incorrect scales can confuse university readers. Students should choose visual formats that match the information they want to present.
A bar chart may help compare categories, while a line graph can show changes over time. Tables are useful when readers need to examine exact values or detailed results. Each visual should have a suitable title and clear labels wherever necessary. Students should also explain the main findings within the surrounding assignment text.
Avoid using too many colors, decorative effects, or unnecessary visual elements. Simple formatting helps readers focus on important patterns and comparisons. Students must also ensure that every chart matches their original data. Clear visual presentation can make statistical findings easier to understand and evaluate.
Ignoring Proper Referencing
Statistics assignments sometimes include information from textbooks, journal articles, reports, and online sources. Students must acknowledge these sources whenever they use another author’s ideas or information. Failing to reference sources correctly can create academic integrity problems. It can also make the assignment appear less reliable or carefully prepared.
Students should follow the referencing style required by their university. They must provide complete details for sources used within their discussion. If a chart or dataset comes from another source, they should acknowledge it appropriately. Students can also review academic assignment writing services to learn about the support available for their academic writing needs.

Students should never invent sources or include references they have not checked. Reliable references help readers verify information and understand the background of the analysis. Careful referencing also demonstrates responsible academic practice. Before submission, students should compare their citations with the final reference list.
Poor Assignment Structure
A well-structured statistics assignment helps readers follow the research process and understand the findings. Some students present calculations without explaining their purpose or connecting them with conclusions. Others place tables and charts in confusing locations throughout their documents. A clear structure makes the work easier to read and assess.
Students can usually organize their assignments around an introduction, methodology, results, discussion, and conclusion. However, they should follow their university’s instructions because requirements can differ between courses. Each section should serve a clear purpose and connect naturally with the next section. Headings can help readers locate important information quickly.
The introduction should explain the research question and the assignment’s main purpose. The methodology should describe the methods used to analyze the data. Results should present the findings, while the discussion explains their meaning. The conclusion should summarize the main outcomes without introducing unrelated information.
Avoiding Proofreading and Final Checks
Submitting an assignment without checking it can leave simple mistakes unnoticed. Spelling errors, incorrect figures, missing labels, and broken formulas can reduce overall quality. Students should leave enough time for reviewing their work before the deadline. A careful final check can help identify problems that were missed earlier.
Before submission, students should review the following points:
- Check every calculation against the original data.
- Confirm that formulas and statistical methods are appropriate.
- Make sure all charts and tables have clear labels.
- Explain the important findings in simple academic language.
- Check citations and references for missing information.
- Follow the required formatting and submission guidelines.
Students should also read the assignment from beginning to end. This helps them check whether the discussion follows a clear and logical order. They can ask a tutor or study partner to review unclear explanations. Careful proofreading makes the final assignment more accurate, organised, and professional.
Conclusion
Avoiding common statistics assignment mistakes can help students produce clearer and more accurate academic work. Careful data checking, correct calculations, and suitable statistical methods support reliable findings. Students should also explain their results clearly and reference all sources properly. Good structure and proofreading can improve the overall presentation of their assignments.
Statistics becomes easier when students practise regularly and understand the purpose behind each calculation. They should start early, follow university instructions, and review their work before submitting. Students seeking additional academic guidance can explore our assignment writing website to find services relevant to their university requirements. Building strong statistical skills can help students approach future assignments with greater confidence.
Frequently Asked Questions
What Are Common Statistics Assignment Mistakes?
Common mistakes include incorrect calculations, unsuitable statistical methods, and poor data interpretation. Missing references and confusing charts can also affect assignment quality.
How Can I Avoid Calculation Errors?
Students should check their formulas, enter data carefully, and review every important result. Comparing selected calculations manually can also help identify mistakes.
Which Statistical Method Should I Choose?
The correct method depends on the research question and type of data. Students should understand their assignment requirements before selecting a statistical test.
Why Is Data Interpretation Important?
Data interpretation explains what statistical results mean and how they answer research questions. It helps students develop meaningful conclusions instead of simply listing numbers.
Where Can I Get Statistics Assignment Support?
Students can visit Assignment Writing Services UK to explore the academic assignment services available. They should choose support that follows their university’s academic integrity rules.