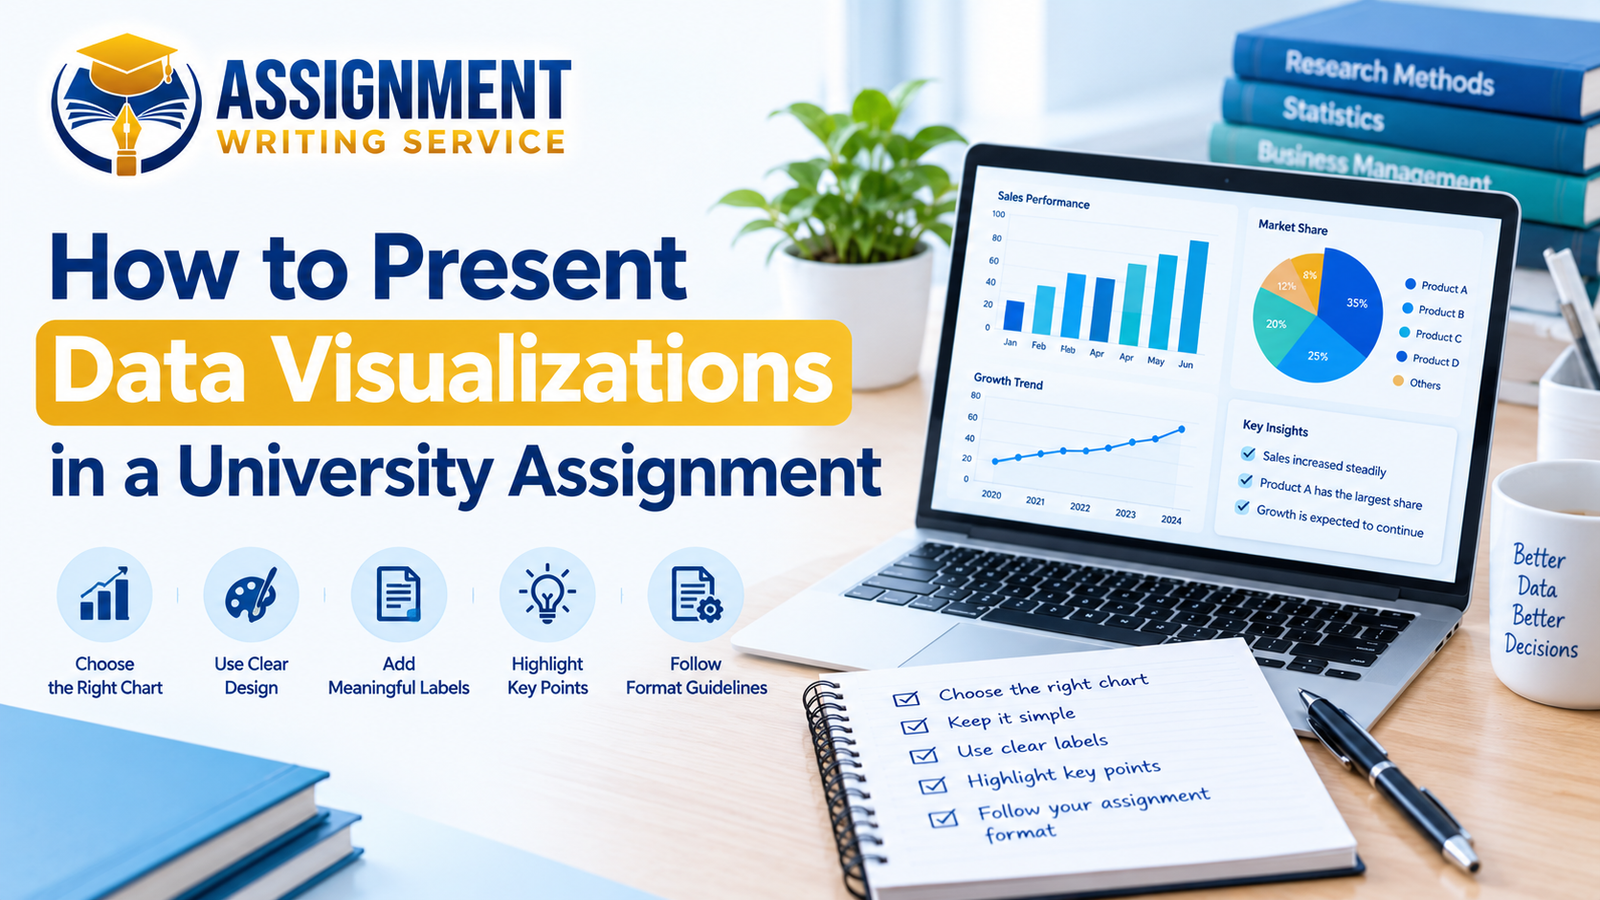
Presenting data visualizations in a university assignment can help students explain information more clearly. Charts, graphs, and tables make complex information easier to understand and compare. They also help readers identify important results without reading long paragraphs of numbers. However, students must choose suitable visuals and explain their meaning within the assignment. Good data presentation can improve the quality, clarity, and overall organization of academic work.
Many university assignments require students to collect information, analyze results, and explain their findings. These tasks are common in business, management, finance, healthcare, marketing, and research projects. Learning how to present data visualizations correctly can make these assignments more effective. Students should also follow their university guidelines and use reliable sources throughout their work.
Understand Your Assignment Requirements
Before creating charts or graphs, students should carefully read their assignment instructions. The assessment brief explains what information they need to present and discuss. Some assignments require statistical analysis, while others focus on research findings or comparisons. Students should identify the main purpose of their data before choosing any visual format.
It is also important to check whether the university allows charts, tables, and diagrams. Some academic tasks have specific formatting rules that students must follow carefully. Following these instructions helps students avoid unnecessary mistakes during their assignment preparation. If any requirement seems unclear, students should ask their tutor for guidance.
Choose the Right Visual Format
Choosing the correct visual format is an important part of presenting data effectively. Different charts and tables communicate different types of information to university readers. Students should select the format that makes their findings easiest to understand. The best choice depends on the data, research question, and assignment purpose.
For example, bar charts are useful when comparing results between different groups. Line graphs can show changes over time or reveal patterns across several measurements. Pie charts can display simple proportions when the number of categories remains manageable. Tables work well when readers need to compare exact numbers or detailed information.
Students should avoid adding visuals simply to make their assignments look more attractive. Every chart, graph, or table should support an important point within the discussion. A suitable visual makes information clearer without creating confusion for the reader. Choosing carefully also helps students maintain a professional academic writing style.
Create Clear and Accurate Charts
A good chart should communicate its message clearly without requiring unnecessary explanation. Students should use meaningful titles that describe the information displayed in each visual. Labels must identify the categories, values, and measurement units wherever these details are relevant. Clear labels help readers understand the findings without guessing what the numbers represent.

Colors should remain simple and consistent throughout the assignment whenever possible. Too many colors, decorative effects, and complicated designs can distract readers from important results. Students should also check that text remains readable when charts appear inside their documents. Accurate scales are equally important because misleading visuals can change how readers interpret findings.
-
Use Suitable Titles
Every chart should have a short title that explains its main purpose. A useful title helps readers understand the visual before studying its details. Avoid vague titles that do not identify the information being presented clearly.
-
Label All Necessary Details
Students should label both axes when creating graphs that require them. They should also include units, categories, and legends whenever these details improve understanding. Missing labels can make accurate information difficult for readers to interpret correctly.
-
Keep the Design Simple
Simple designs allow readers to focus on the information rather than unnecessary decoration. Avoid three-dimensional effects unless they are genuinely needed for the data. Consistent fonts and colors also help create a clean academic document.
-
Check the Accuracy
Students should compare every chart with the original data before submitting assignments. Incorrect percentages, missing values, and unsuitable scales can weaken their academic arguments. Careful checking helps ensure that the visual supports the correct research findings.
Explain Your Data in Writing
Charts and graphs should support academic writing rather than replace the written discussion. Students need to explain what each visual shows and why the information matters. Simply inserting a graph without discussing its findings may leave readers confused. A strong explanation connects the visual evidence with the assignment’s main research question.
For example, a bar chart might compare customer satisfaction across three different businesses. Students should identify the highest and lowest results and explain their possible meaning. They should also connect these results with relevant research or suitable academic sources. This approach demonstrates understanding instead of simply repeating numbers from the chart.
Students should avoid describing every single value when only major findings matter. Instead, they should focus on important differences, patterns, and unexpected results. Their written discussion should remain accurate and should not claim more than the data supports. This method helps readers follow the argument and understand the research more effectively.
Add Proper Captions and References
Captions help readers understand the purpose of charts, graphs, and tables. Each visual should have a clear number and an informative title or caption. Universities may have different rules about where titles and captions should appear. Students should follow their required referencing style and assignment formatting instructions.
When using information from another source, students must acknowledge the original author. This includes charts, statistics, diagrams, and visuals copied or adapted from published research. The source should appear in the appropriate caption or note when required. A complete reference should also appear in the assignment’s reference list.
Students should never present another person’s data visualization as their own original work. They should check whether permission or specific conditions apply before reproducing published material. Correct referencing supports academic honesty and helps readers locate the original information. It also strengthens the reliability of the assignment’s evidence.
Avoid Common Presentation Mistakes
Students sometimes make avoidable mistakes when adding visual information to university assignments. These mistakes can make reliable findings difficult to understand or compare. Reviewing each visual before submission can help students identify problems early. The following points highlight mistakes that students should avoid during preparation.
- Using charts that do not match the research question.
- Adding too many visuals without explaining their importance.
- Leaving titles, labels, captions, or measurement units unclear.
- Using incorrect figures or presenting misleading scales.
- Forgetting to reference data taken from external sources.
- Repeating every number in the written discussion unnecessarily.
Students should check that each visual contributes something useful to the assignment. Removing unnecessary charts can make the document more focused and easier to read. They should also confirm that all figures match the final version of their data. Careful editing helps create a more accurate and professional academic submission.
Organize Visuals Within Your Assignment
The placement of data visualizations can affect how easily readers follow an assignment. Students should position each visual close to the paragraph that discusses it. This arrangement helps readers connect the evidence with the explanation immediately. Each chart or table should also appear in the correct numerical order.
Students should introduce a visual before discussing its main findings. For example, they might write, “Figure 1 compares the survey results across three groups. “They can then explain the most important differences and their relevance to the research. This simple structure creates a clear connection between evidence and academic arguments.

If a dataset contains many detailed values, students may use an appendix when appropriate. The main discussion should focus on the results most relevant to the assignment question. However, students must follow their university’s rules about appendices and additional materials. Good organization makes academic work easier to navigate and understand.
Improve Your Academic Assignment Quality
Presenting data correctly is only one part of preparing a successful university assignment. Students must also develop a clear argument, use reliable evidence, and explain their findings. Grammar, structure, referencing, and critical analysis all contribute to overall academic quality. Careful proofreading can help identify weaknesses before the final submission.
Students who struggle with data presentation may benefit from additional academic writing guidance. They can review university resources, practice using spreadsheet tools, and study relevant examples. Feedback from tutors can also help them improve their charts and written explanations. Regular practice makes it easier to present research findings with confidence.
For students who need further academic support, Assignment Writing Services UK offers a website to explore assignment writing assistance. Students can review the available services to find support suited to their academic requirements. Any support should help them understand the subject and develop their own skills. They should also follow university rules on originality and permitted academic assistance.
Review Before Submission
A final review helps students ensure that their data visualizations are accurate and useful. They should examine the visuals alongside the assignment instructions and marking criteria. Every chart should support the discussion and connect with the research question. Students should also check that the document follows the required academic style.
Before submitting, students should confirm that:
- All visuals have clear titles and appropriate labels.
- Figures and tables appear in the correct order.
- Data match the original results and written discussion.
- Sources are acknowledged using the required referencing style.
- Charts remain readable in the final document.
- Each visual is explained within the assignment text.
Students should also review spelling, grammar, page layout, and paragraph flow. These final checks can prevent small errors from affecting the quality of their work. A well-organized assignment makes its findings easier to understand and assess. Careful preparation can help students present their research in a clear and responsible way.
Conclusion
Learning how to present data visualisations in a university assignment helps students communicate research findings more effectively. Suitable charts, clear labels, accurate figures, and useful explanations improve academic clarity. Students should also reference external sources and follow their university’s formatting requirements. Avoiding common mistakes can make assignments more organized, reliable, and easier to understand.
Students should remember that visuals are most useful when they support meaningful analysis. Every chart or table should contribute to the assignment rather than simply decorate its pages. With regular practice and careful checking, students can develop stronger data presentation skills. For additional academic writing guidance, visit Assignment Writing Services UK and explore the services available for your study needs.
Frequently Asked Questions
What Are Data Visualizations in Assignments?
Data visualizations are charts, graphs, tables, and diagrams used to explain information. They help students present research findings clearly and make comparisons easier for readers.
Which Charts Are Best for University Assignments?
Bar charts are useful for comparing categories, while line graphs show changes over time. Tables are suitable when readers need exact values or detailed information.
Do I Need to Explain Every Chart?
Yes, students should explain the main findings and relevance of each visual. They should connect the information with their research question and assignment argument.
Should I Reference Charts From Other Sources?
Yes, students must acknowledge sources when using or adapting someone else’s visual material. They should follow their university’s referencing rules and include complete source details.
Can Data Visualizations Improve Assignment Quality?
Clear visuals can make complex findings easier to understand and compare. However, they must be accurate, relevant, properly labelled, and supported by written analysis.